IPAD Integration in the classroom
|
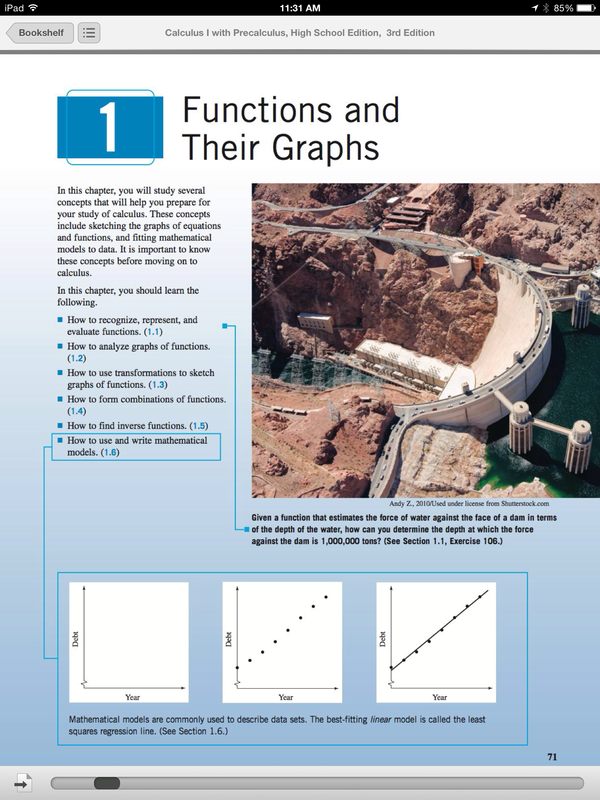
New Online Textbooks with interactive/online help
|
|
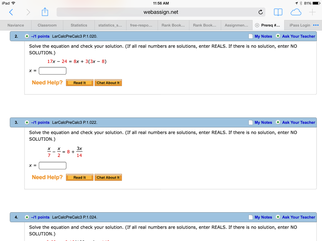
Web Assign allows us to assign homework for students to view online, get extra help, see review problems, read the text & view online tutorials. Students get 3-5 chances to get the problem correct and the program automatically grades the problem.
|
|
|
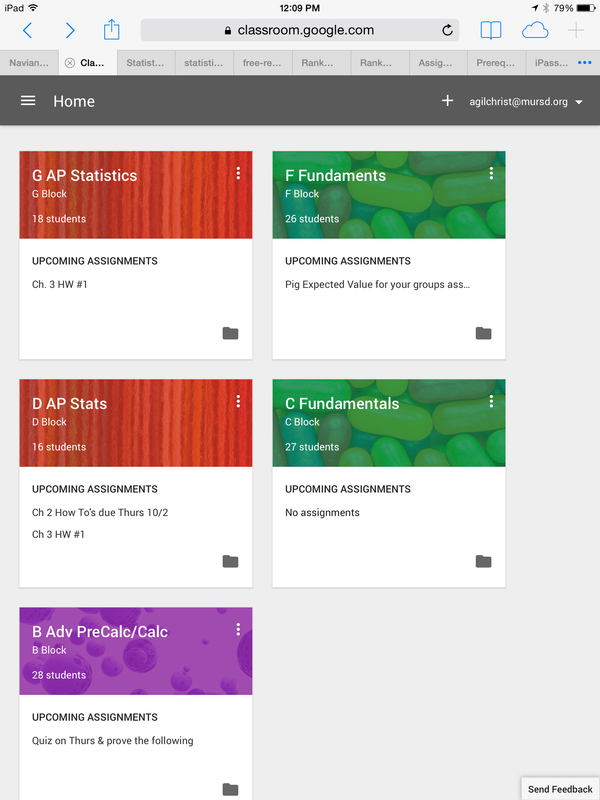
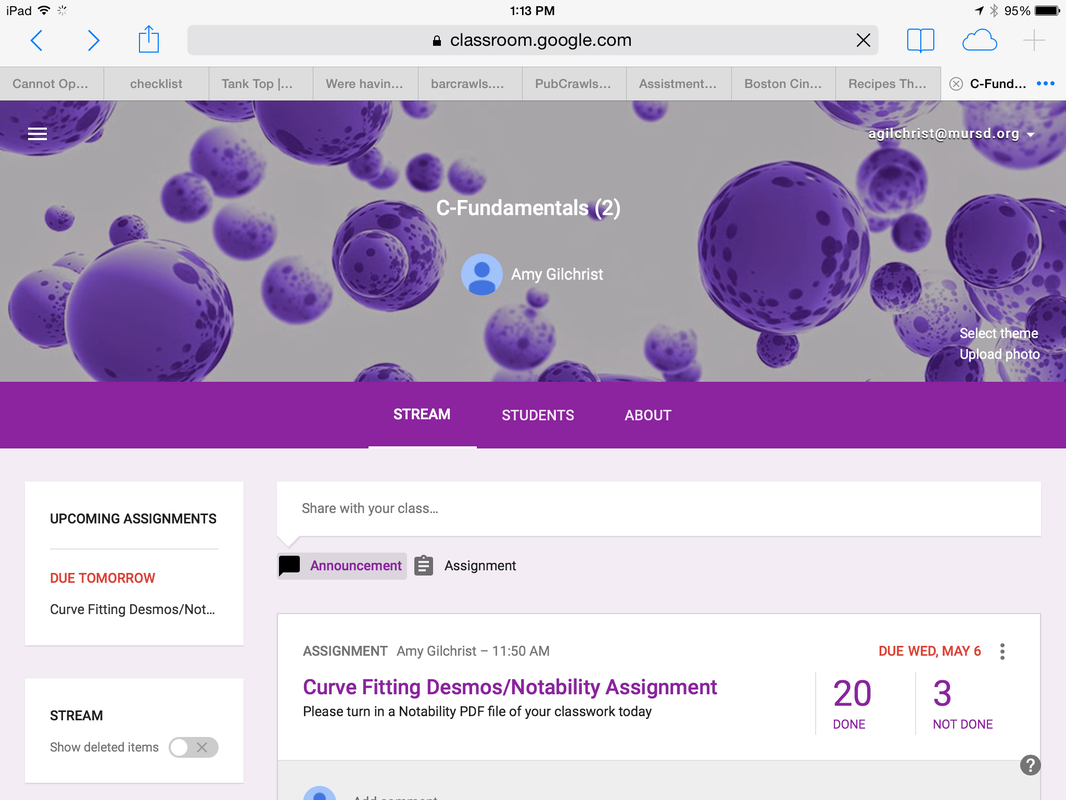
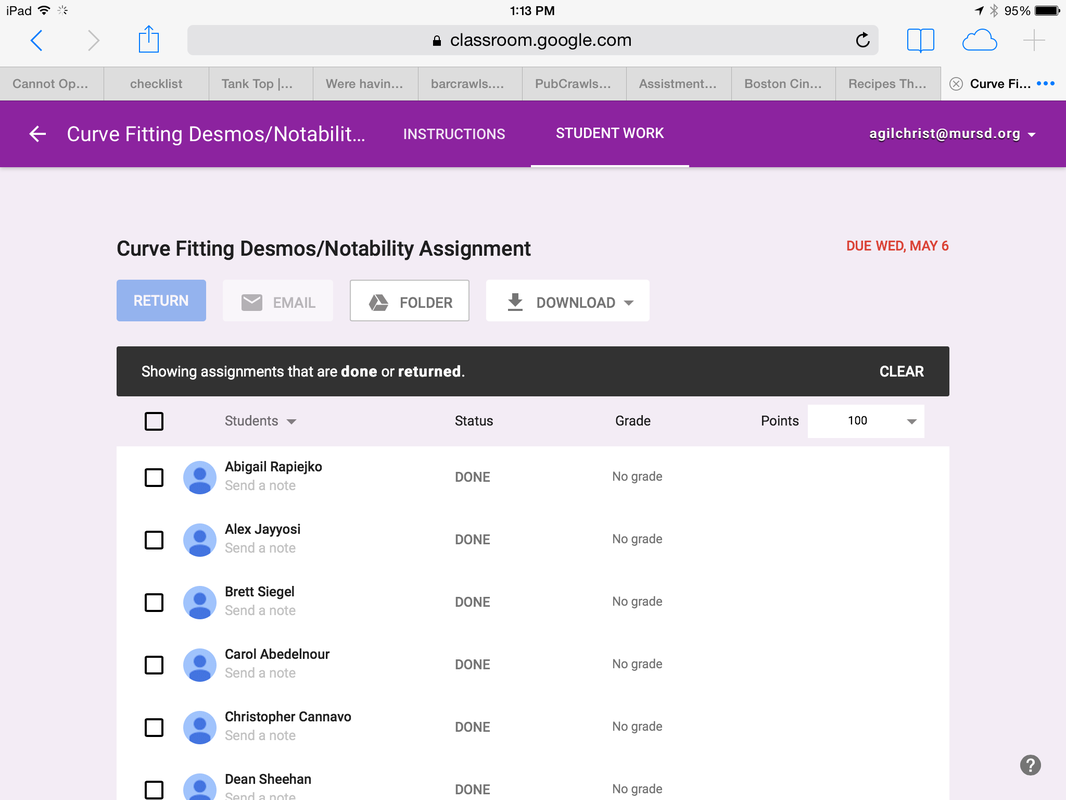
Using Google Classroom allows students to see their assignments, teacher announcements & download files onto their IPAD's from 1 place. For instructions on how to view classroom, go to student's class & then the homework tab or email me to be invited into a class!
|
|
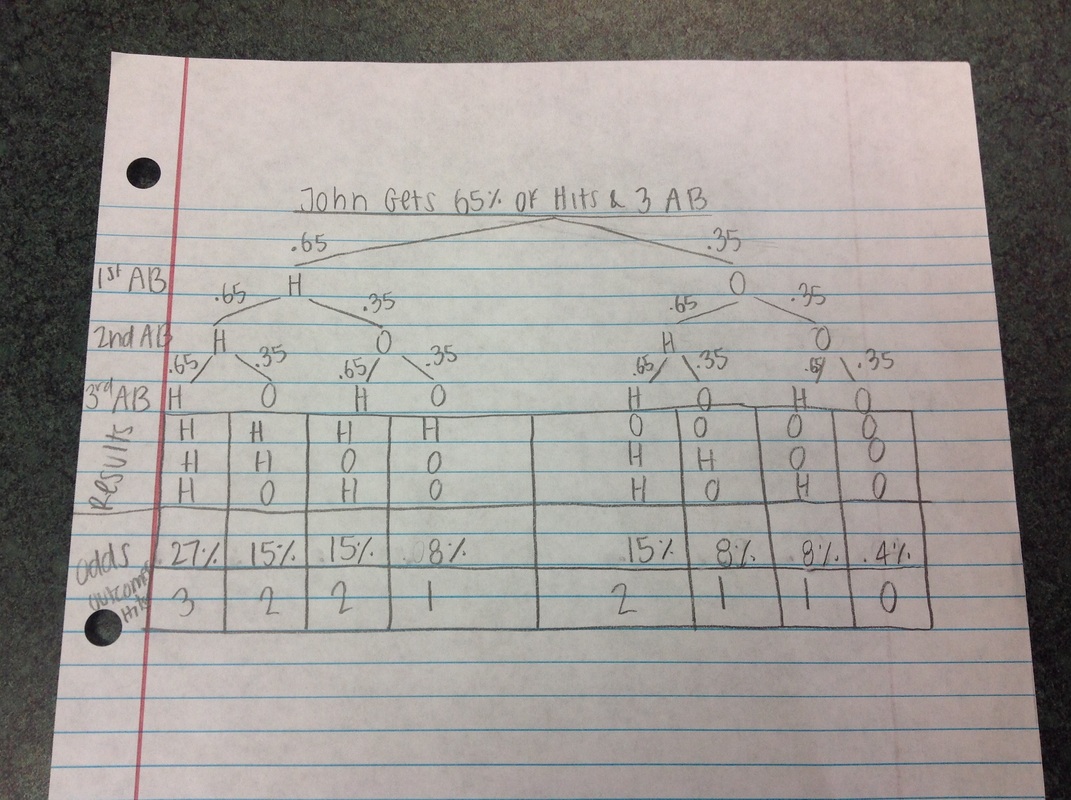
Students now take pictures of their work & share with the class using Air Play (what is on their IPAD gets projected on the white screen in the front of the class) or they can collaborate with a friend using Air Drop (sends a picture from one IPAD to another).
|
|
|
|
Using Notability to take notes, do practice problems, take pictures of others work & insert into notes, insert calculator shots to support notes, etc. Students can highlight, insert graph paper to use for graphing, type or write using a stylus or their finger...
|
|
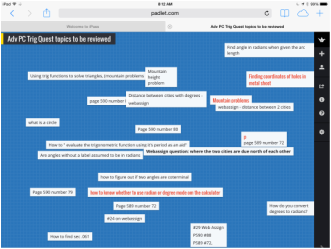
Using Padlet (an interactive cork board) as a warm-up activity allowed students to have input into what I covered in their test review. Students posted their questions & either others students or I reviewed the questions. Students liked the fact that it was anonymous (even though I tell them no question is stupid).
|
|
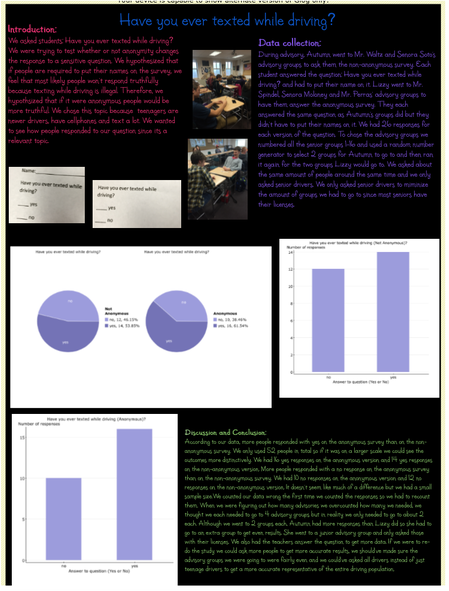
In AP Statistics students were given a variety of technology options to present the findings of their biased survey analysis. Some samples include a Prezi and a Glogster (presented here). Students were able to airplay these visuals and use their ipads to zoom in on each part as they went thru their presentations.
|
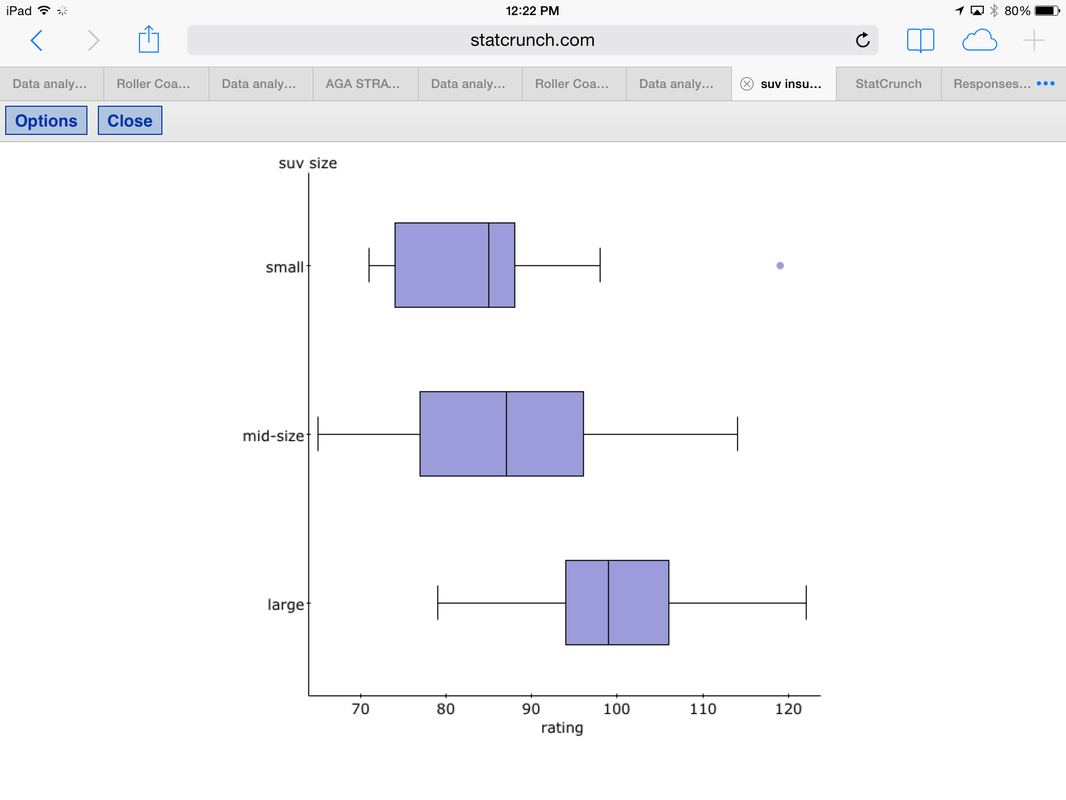
Today we started importing and analyzing real world data sets in a statistical software package used by many colleges (STATCRUNCH). We looked at roller coaster data, analyzed our facebook friends and started this project to compare insurance rates for small, mid-size and large SUV's for an insurance company. 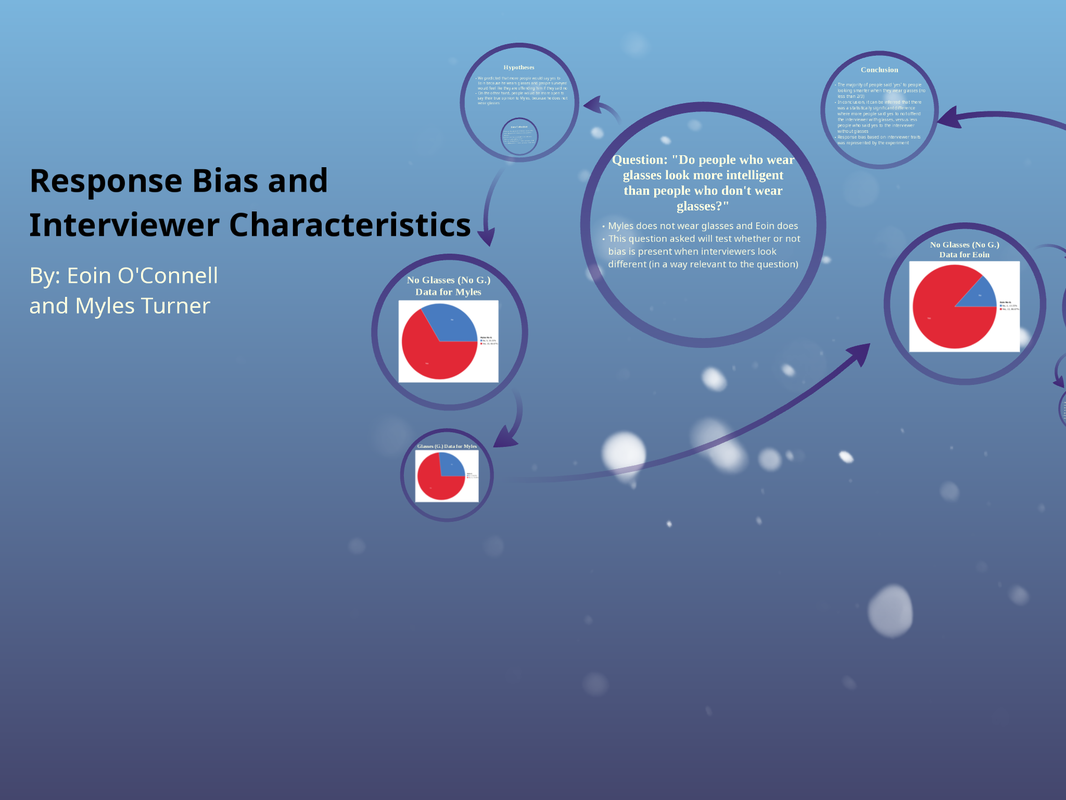
|
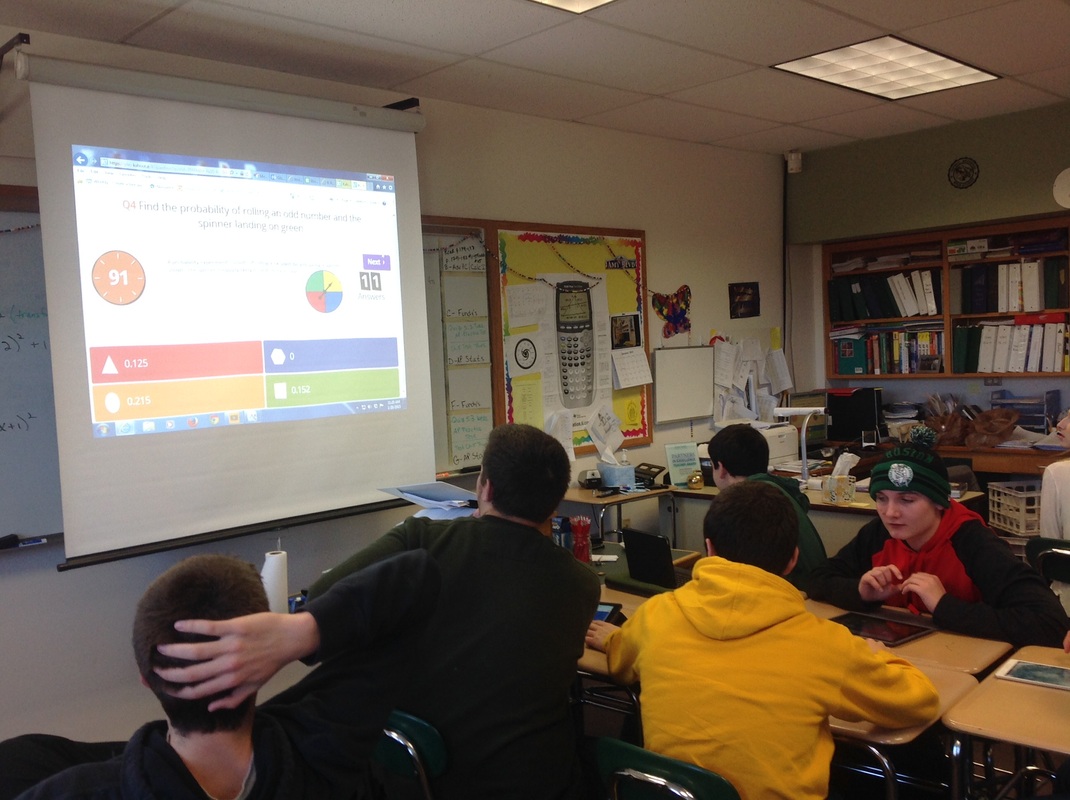
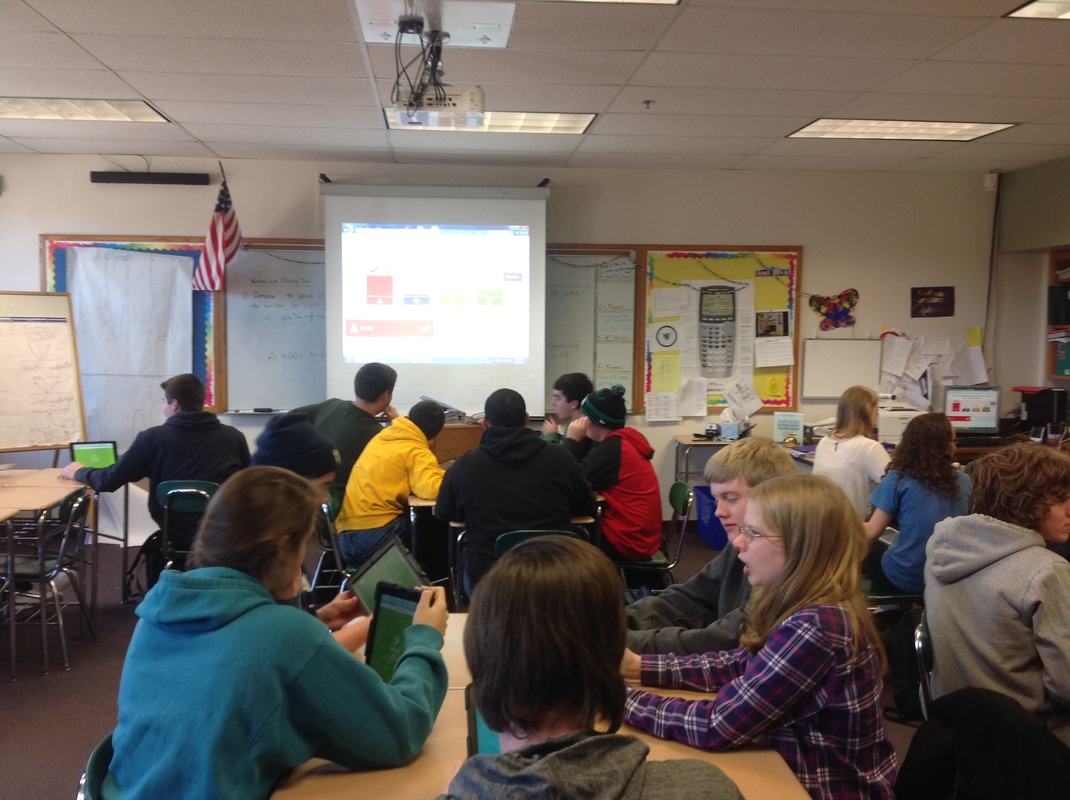
Game show style Probability Review using an IPAD APP called Kahoot! Students raced to enter the correct answer to the listed problem onto their IPADS.
|
|
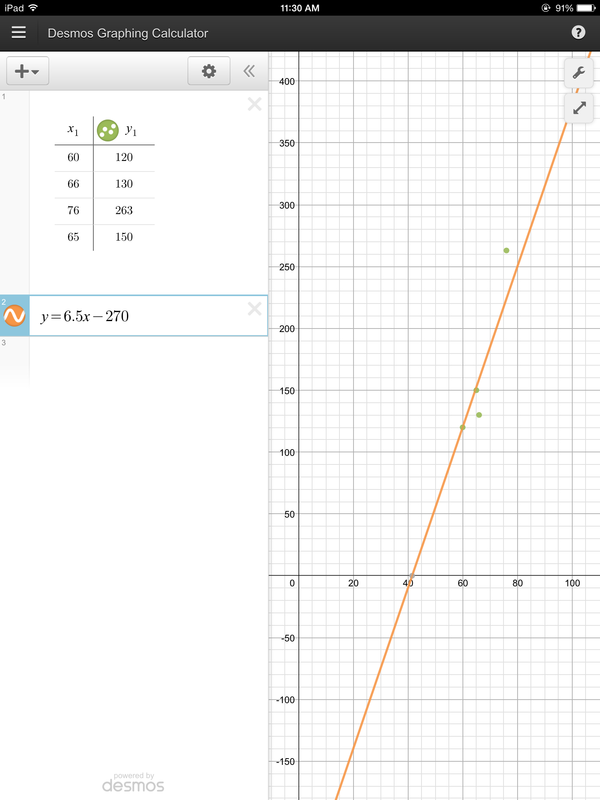
scatter plots & curve fitting using the desmos graphing app
|
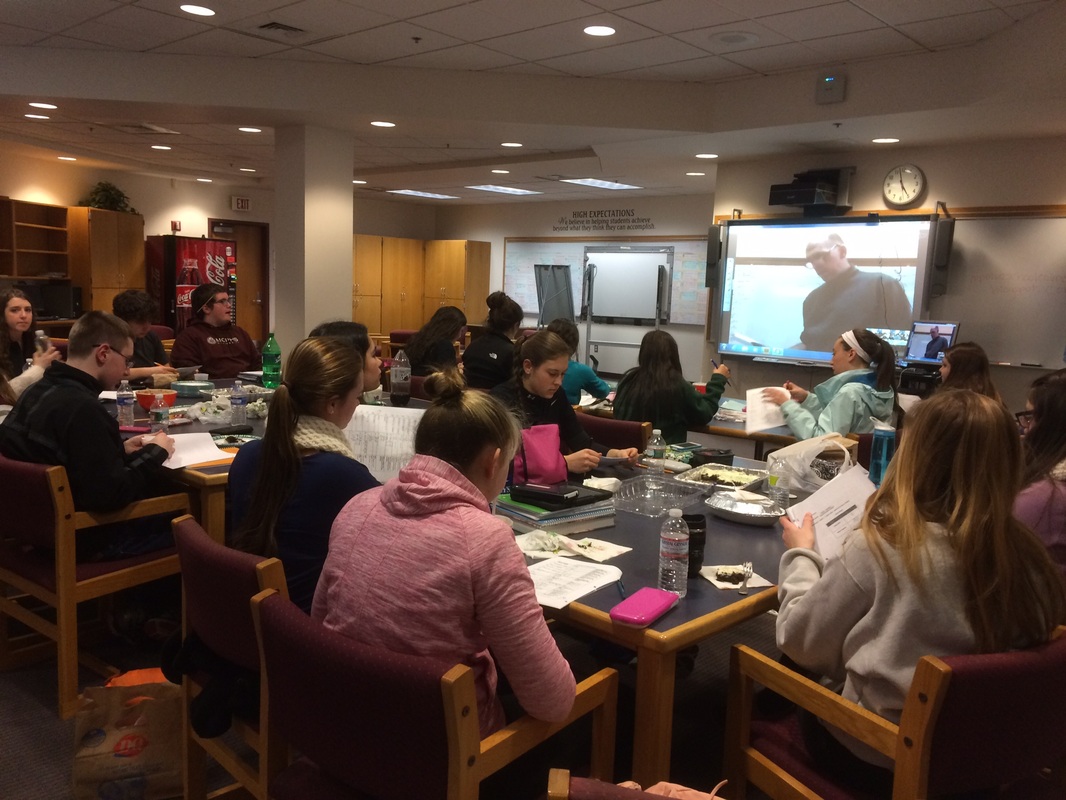
AP Stats students skyped with a Statistics "guru" teacher from Maine through the use of an IPAD. Below is a sample of an assignment from fundamentals created in notability, using Desmos graphs & submitted thru google classroom (No more paper!?!)
|
